

OLAP, OLTP, Cubes, but before we go ahead, I assume you have read the previous post or you already know what is a Data Warehouse. If not, read it first by clicking here. Now, as part of the Data Warehouse universe, let’s talk about cubes and OLAP!
What OLAP means?
The OLAP (Online Analytical Processing) term was used for the first time by Edgar Frank Codd. For the ones that have studied at university about relational database has listened about him as the “father” of the relational database. According to his understanding, OLAP is a technology category of software that allows getting data information quickly, consistency, and interactively, that were transformed from some raw data to reflect the company dimension, according to the user needs. Ralph Kimball, the ones from Data Warehouse definition, define a little differently and shortly: Consultancy representation of textual and numeric data of a Data Warehouse.
To define OLAP applications, Codd have defined 12 rules:
- Multi-dimensional conceptual view of the database
- Transparency concept
- Accessibility concept
- Consistent reporting performance
- Client-server architecture
- Generic dimensionality
- Dynamic sparse matrix handling
- Multi-user support
- Unrestricted cross-dimensional operations
- Intuitive data manipulation
- Flexible reporting
- Unlimited dimensions and aggregation levels
When we talk about OLAP, we should talk about OLTP too. According to Microsoft documentation, OLTP (or Online Transaction Processing) “systems record business interactions as they occur in the day-to-day operation of the organization, and support querying of this data to make inferences”. Below you can see the main differences between then:
| OLTP | OLAP | |
| Type | Transactional System | Analytical System |
| Characteristics | Focus in a high number of transactions | Focus in a large volumes of data and complex queries |
| Granularity | Detailed | Aggregated |
| Query types | Simple standard queries | Complex and flexible queries |
| Database Operations | INSERT, UPDATE, DELETE and SELECT | Most of SELECT commands to aggregate data for reporting |
| Response time | Milliseconds for the simple amount of data | Seconds, minutes, or hours depending on the amount of data to process and load |
| Source | Transactions | Aggregated data from transactions |
| Purpose | Control of ongoing business operations in real-time | Plan, give direction, support decisions, discover insights, look for past data |
| Data updates | Short, fast updates commonly initiated by the user | Data periodically refreshed with scheduled, long-running batch jobs |
| Space requirements | Generally small if historical data is archived | Generally large due to aggregating large datasets |
| Backup and recovery | Regular backups required to ensure business continuity and meet legal and governance requirements | Lost data can be reloaded from OLTP database as needed in lieu of regular backups |
| Productivity | Support the productivity of end-users | Support the productivity of business managers, data analysts, and executives |
| Database design | Normalized databases for efficiency | Denormalized databases for analysis |
| Data behavior | Constantly changeable (with restrictions) | Not changeable (with restrictions) |
In general, one of the classics measures to provide OLAP data reporting is storing data in Cubes objects, due to performance and database flexibility.
Cubes and terminology
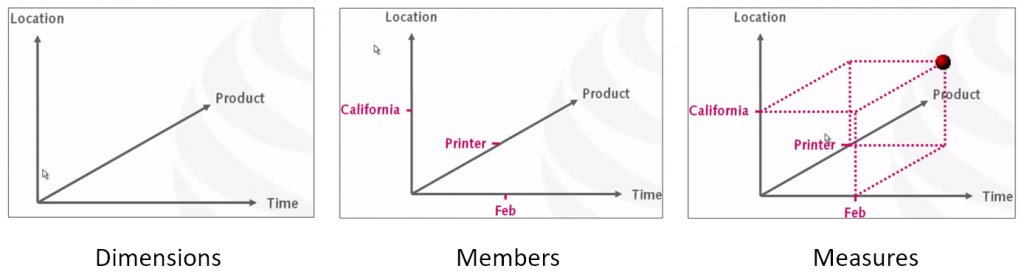
- a Cube can be considered a multi-dimensional generalization of a set of data organized in a different matrix that can fits together for some desired result, promoting flexible and fast analysis possibilities.
- Cubes are composed by Dimensions: a group of members (characteristics) that converges all together with the same topic, in the same face.
- Measures are part of Fact tables, that are special dimensions used to store all calculable values, it means, SUM, AVERAGE, MAX, MIN, COUNT, etc.
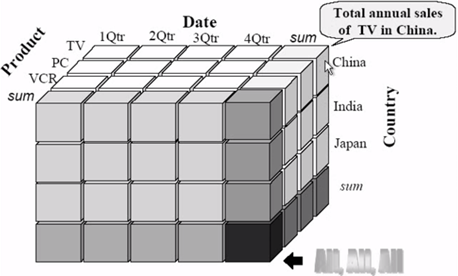
To get it a little more simple, let’s check the example of a multidimensional data set product sales around the world along with them some time.
- Dimensions: Product, Date, and Country
- Members (respective dimensions):
- TV, PC, VCR
- 1Qrt, 2Qrt, 3Qrt, 4Qrt
- China, India, Japan
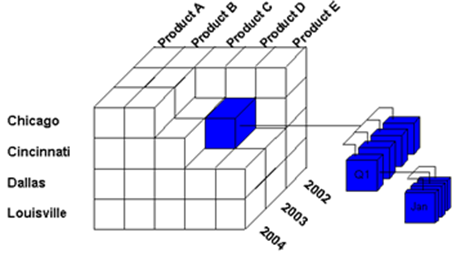
- Measures would be each piece of that cubes, where the more you pick up pieces, the more you aggregate your data.
Even it’s named and represented as a cube, actually from the relational database scheme it’s is commonly designed by a star schema, where it’s possible to see clearly all dimensions connected through the same Fact table:
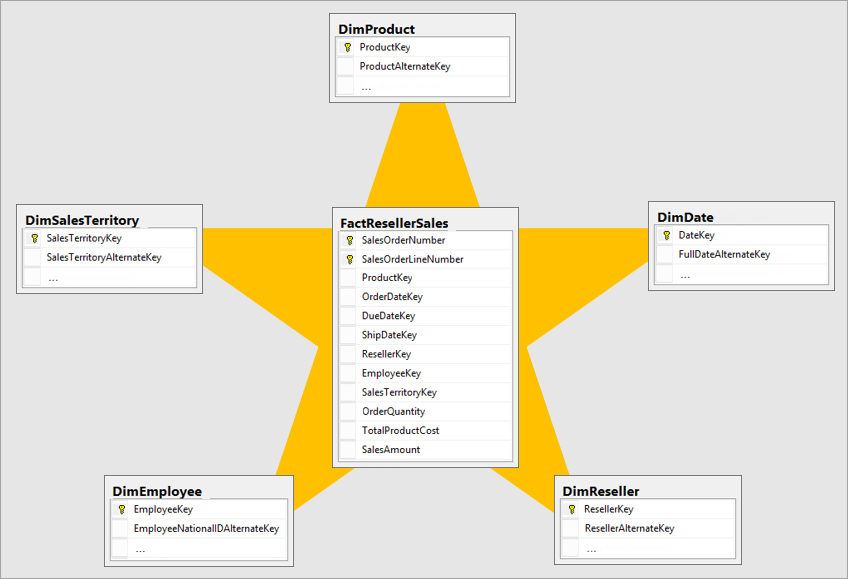
Star-Schema
The star schema have two types of tables:
- Facts: Measures of a process, generally numeric and agreeable (e.g. sales amount), or contable quantitatives. It have characteristics connetions with the another tables (dimmensions). In a star schema there is only one fact table.
- Dimensions: These are formed by relevant caracteristics as when, where, what, how, from, to, etc. (e.g. customer, supplier, partner, data-time, adress). Usually, a star-scheme is based in multiple dimension , all of them connected through the fact table.
Advantages
- It makes the query selection easy, scripted, or note, it’s much more simple work in that model.
- Good performance for reading command.
- Self-explainable model, simple to understand or explain,
Disadvantages
- It’s not a model to receive constants inserts/updates, due to not normalized relations. It needs a specific load process that can take some considerable time, normally out of business time.
- Once it’s modeled, it’s not so flexible for different business understanding, due to it’s constructed based and focused on some business report need.
Author
- BI System Analyst, Computer Engineer & Developer
- “Networking it’s not about how many connections you have, but the much you are really connected to them. - Let’s learn, let’s share.”
Latest entries
- November 1, 2020PeopleI’m not an Analyst.
- August 19, 2020TechnologyWhat about Society 5.0
- August 18, 2020TechnologyWhat about UI (User Interface)?
- August 9, 2020DevelopmentHow to create your first CDS View